
Tour-First Measurement: Replace Vanity Traffic with Booked Tours & Design-Center Appointments
Last Updated: December 19, 2025 • 12 min read
📌 Key Takeaways
Booked tours—not traffic or rankings—are the true measure of local SEO success for luxury homebuilders.
- Tours Are the Scoreboard: Sessions and rankings measure potential; booked tours and design-center appointments confirm actual business outcomes.
- Build a KPI Ladder: Organize metrics by distance from revenue—leading indicators signal visibility, mid-funnel indicators reveal intent, and lagging indicators confirm conversions.
- UTM Governance Prevents Data Corruption: A single naming convention locked into dropdown builders stops the “same thing with five names” problem that breaks attribution across communities.
- CRM Status Taxonomy Enables Handoffs: Explicit statuses mapping the buyer journey (Lead → Tour Scheduled → Tour Completed → Design-Center Appointment) clarify ownership between marketing and sales.
- Attribution Coverage Rate Is a KPI: Tracking what percentage of booked tours have valid source data reveals how much of your measurement system actually works.
If it doesn't book tours, it's not a KPI.
Marketing directors and operations leads at luxury homebuilders managing multi-community portfolios will gain a complete measurement framework here, preparing them for the worksheet and implementation steps that follow.
The dashboard looks impressive. Sessions up 40%. Rankings climbing. Yet the model centers sit quiet, and the executive team keeps asking the same question: where are the tours?
Tour-first measurement is a reporting framework that replaces traditional SEO vanity metrics with a KPI ladder anchored to booked tours and design-center appointments. For luxury homebuilders and community developers operating in a research-online-book-offline environment, this approach treats local visibility as a leading indicator and scheduled tours as the definitive measure of success.
Think of it like running a jobsite. A site superintendent doesn't measure progress by how many materials got delivered—they measure by inspections passed and punch lists closed. Impressions and clicks are your materials. Booked tours are your inspections. Design-center appointments are your fixture selection walk-through. A schedule-aware SEO plan mirrors this thinking: visibility means materials staged and crews scheduled, intent actions mean inspections queued and dependencies cleared, and booked tours mean milestones achieved.
Picture a buyer searching "luxury homes in [ZIP]." They scroll through the Map Pack, click your community profile, browse floor plans, then schedule a tour for Saturday. That journey—from search to scheduled appointment—is what tour-first measurement captures. Traffic reports miss half of it. This ROBO pattern (research online, book offline) defines how luxury homebuyers actually convert, and your measurement system needs to reflect it.
This framework delivers three things: a KPI ladder that executives actually trust, a measurement reset worksheet you can implement this week, and a lightweight attribution workflow that respects how luxury homebuyers actually convert.
Why Traffic Is the Wrong Scoreboard
Sessions and rankings feel like progress. They're easy to report, trending in the right direction, and your agency sends them every month. But they measure potential, not outcomes.
The disconnect becomes obvious when traffic climbs while tours stay flat. Marketing celebrates visibility gains. Sales wonders why the pipeline hasn't moved. Leadership loses confidence in the entire program.
This happens because luxury homebuyers follow that ROBO pattern—research online, book offline. They might visit your site six times across three devices over eight weeks before ever scheduling a tour. Traditional analytics tracks the visits but loses the thread when someone picks up the phone or walks into a model center.
The solution isn't abandoning traffic metrics entirely. It's demoting them to their proper role as leading indicators while elevating booked tours as the primary KPI. For deeper context on why community-level visibility outperforms brand-term rankings, see Tour-First Local SEO: Why Community-Level Visibility Beats Brand-Term Rankings.
Phase 1: Migrating From Legacy Measurement to Tour-First KPIs
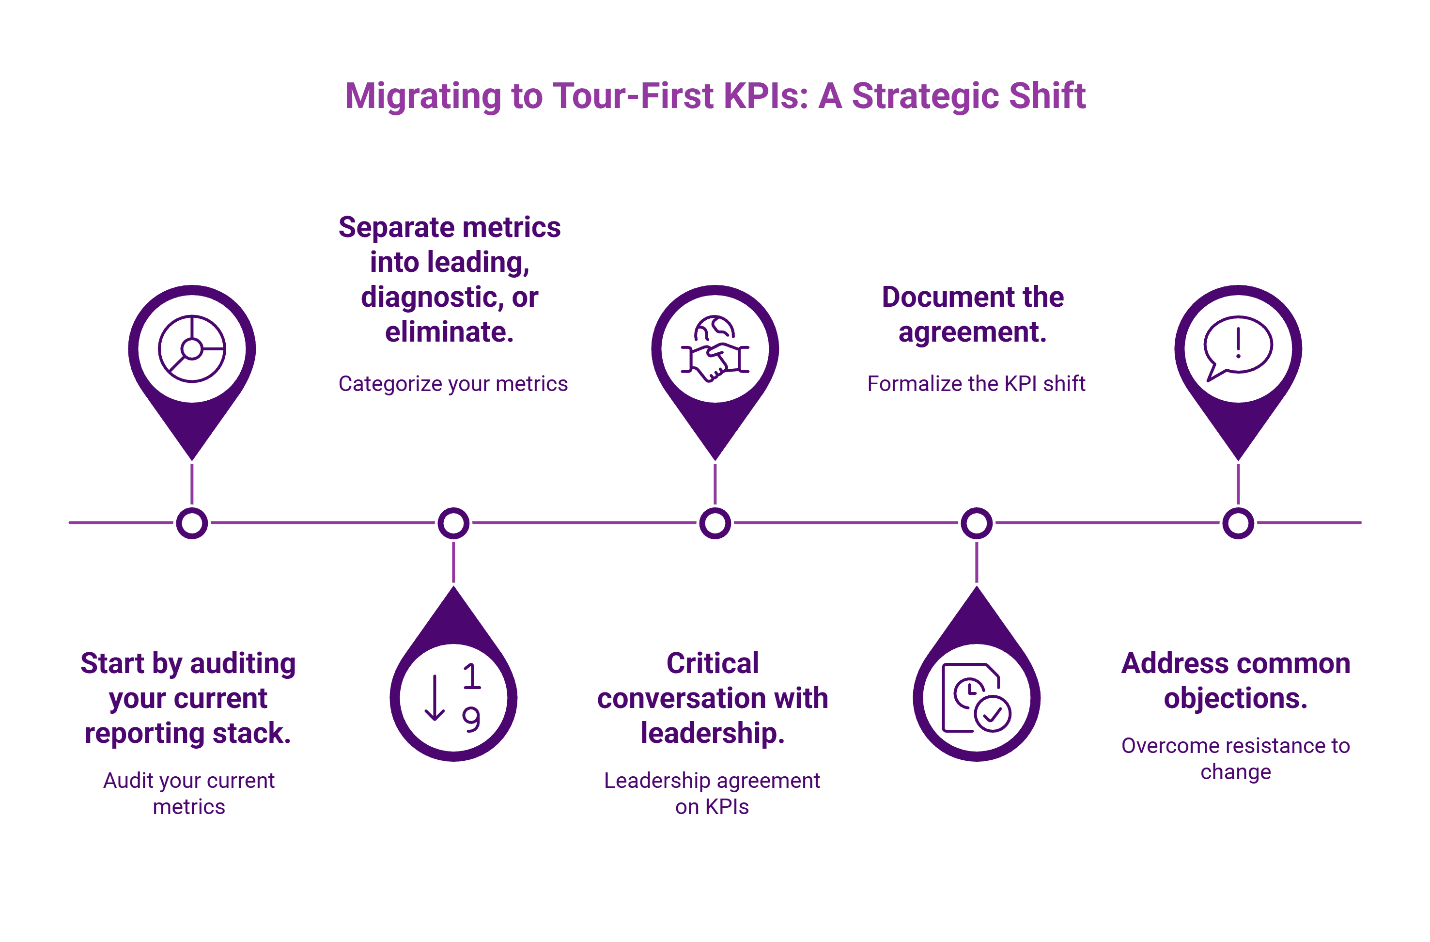
Start by auditing your current reporting stack. Most builders inherit a "vanity stack" that includes total sessions, keyword rankings, bounce rate, and generic form submissions. These metrics aren't useless—they're just positioned wrong.
Separate your metrics into three categories: keep as leading indicators, demote to diagnostic only, or eliminate entirely. Sessions from community pages? Keep as a leading indicator. Sitewide bounce rate? Demote to diagnostic. Rankings for terms nobody searches? Eliminate.
The critical conversation happens with leadership. Get explicit agreement that booked tours and design-center appointments are the primary KPIs. Everything else supports those outcomes. Document this agreement—it prevents the inevitable "but traffic is down" objection three months later.
Common objection: "We need more traffic first."
Traffic without tour intent is noise. A thousand sessions from people searching "how to build a house" won't book tours. A hundred sessions from people searching "new construction homes [COMMUNITY NAME]" might book ten. Volume matters less than intent alignment.
Common objection: "Rankings prove progress."
Rankings are a proxy for visibility, and visibility is a proxy for discovery, and discovery is a proxy for tours. That's three layers removed from revenue. Track rankings if you want, but don't report them as success metrics.
Common objection: "Sales owns tours; marketing owns search."
That split is exactly why governance is required. Marketing can own UTMs and page/GBP instrumentation; Sales can own status hygiene and show-rate tracking. Shared definitions prevent blame-based reporting.
Phase 2: Building the KPI Ladder
The ladder organizes metrics by their distance from revenue. Leading indicators signal visibility. Mid-funnel indicators signal intent. Lagging indicators confirm conversions. This structure aligns with widely accepted performance management practice: leading indicators support near-term steering, while lagging indicators confirm real outcomes. This principle is foundational to standard performance management frameworks (like the Balanced Scorecard methodology).
KPI ladder example (builder-ready)
| KPI Category | Metric | Owner | Cadence | Tool |
|---|---|---|---|---|
| Leading | Map Pack impressions | Marketing | Weekly | GBP Insights |
| Leading | Search impressions (community terms) | Marketing | Weekly | Search Console |
| Leading | Profile views | Marketing | Weekly | GBP Insights |
| Mid-Funnel | Direction requests | Marketing | Weekly | GBP Insights |
| Mid-Funnel | Calls from profile | Sales/Marketing | Weekly | Call tracking |
| Mid-Funnel | Tour CTA clicks | Marketing | Weekly | Analytics |
| Lagging | Booked tours | Sales | Weekly | CRM |
| Lagging | Tour show rate | Sales | Monthly | CRM |
| Lagging | Design-center appointments | Sales | Monthly | CRM |
| Governance | Attribution coverage rate | Marketing/Ops | Quarterly | Analytics + CRM |
Leading indicators tell you whether your local presence is generating discovery. The Google Business Profile Performance API provides standardized definitions for profile interactions, eliminating guesswork about what "views" or "actions" actually mean.
Mid-funnel indicators reveal intent. Someone requesting directions or clicking "book a tour" has moved beyond browsing. These metrics forecast tour volume 2-4 weeks out.
Lagging indicators confirm what actually happened. Booked tours are the handoff from marketing to sales. Show rate measures follow-through. Design-center appointments track progression toward contract.
Attribution coverage rate deserves special attention. This metric tracks what percentage of booked tours have valid UTM data connecting them back to their origin. It's not an embarrassment when coverage is incomplete—it's a governance KPI that tells you how much of your attribution system is actually working.
For implementation details on maximizing Map Pack visibility, see Map Pack Mastery for Model Centers.
Phase 3: Closing the Loop With UTMs and CRM Statuses
Attribution breaks when the online journey ends with an offline conversion. Fixing this requires two things: consistent UTM tagging and a CRM status taxonomy that marketing can actually report against.
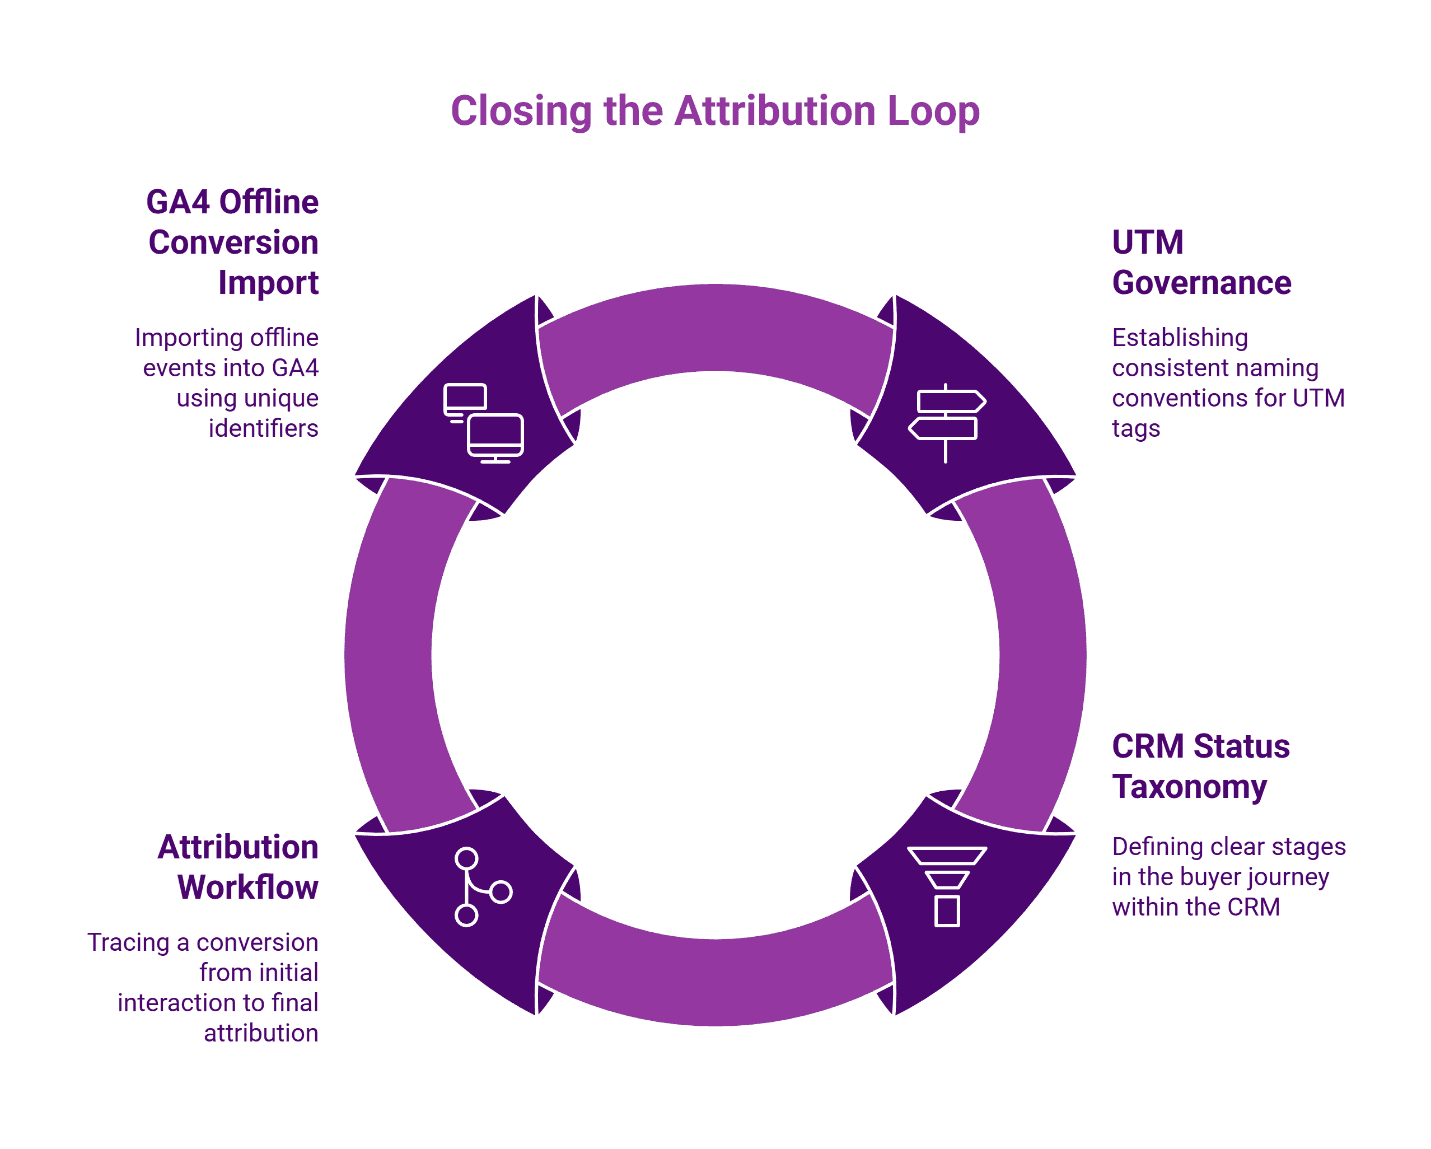
UTM Governance
Establish a single naming convention and enforce it everywhere. Google's campaign URL builder documentation provides the standard parameter structure. A practical convention for builders:
Source: the platform where the traffic originated (e.g., google, facebook). Note: To ensure traffic flows correctly into GA4's Default Channel Grouping, it is generally recommended to keep the source as 'google' and distinguish the placement via the Campaign or Content parameters.
Medium: channel type (organic, local, paid, email)
Campaign: specific initiative (spring-release, model-grand-opening)
Lock these into a dropdown builder or spreadsheet. Freeform UTM entry guarantees inconsistency within weeks. One naming convention prevents the "same thing with five names" problem that corrupts attribution data across communities.
CRM Status Taxonomy
Your CRM needs statuses that map to the buyer journey. At minimum:
- Lead (inquiry received)
- Tour Scheduled
- Tour Completed
- Design-Center Appointment Scheduled
- Design-Center Appointment Completed
Marketing reports on the first three. Sales owns progression beyond. The handoff point is explicit.
The Attribution Workflow
Here's how a single conversion flows through the system:
- Buyer sees community in Map Pack for "[CITY] new construction homes"
- Clicks profile link tagged with UTM (source=gbp-[community], medium=local)
- Lands on community page, browses floor plans
- Clicks "Schedule a Tour" CTA (event tracked in analytics)
- Completes booking in scheduling tool
- CRM record created with source field populated from UTM
- Tour completed → status updated → attributed to local SEO
Google Analytics 4 (GA4) supports importing offline conversion events by matching a unique identifier—specifically the Google Client ID (CID) or User-ID—stored in your CRM. This method effectively closes the loop and attributes revenue to digital channels without uploading restricted Personally Identifiable Information (PII) into the analytics environment.
For more on connecting visibility metrics to booked outcomes, see Tracking What Matters in Local SEO: From Visibility to Booked Tours.
Measurement Reset Worksheet
Use this framework to document your tour-first measurement system:
KPI Ladder Definition
Leading indicators we'll track: _____________
Mid-funnel indicators we'll track: _____________
Lagging indicators (primary KPIs): _____________
Ownership Assignment
Marketing owns: _____________
Sales owns: _____________
Shared accountability for: _____________
Cadence
Weekly review: _____________
Monthly review: _____________
Quarterly governance audit: _____________
UTM Dictionary
Source values: _____________
Medium values: _____________
Campaign naming convention: _____________
QA checklist owner: _____________
CRM Status Taxonomy
Stage 1: _____________
Stage 2: _____________
Stage 3: _____________
Stage 4: _____________
Executive Dashboard View
Primary KPI displayed: _____________
Supporting metrics included: _____________
Excluded vanity metrics: _____________
Scaling Operations Across Communities and Models
Single-community measurement is straightforward. Multi-community portfolios introduce governance challenges.
Template Governance
Every community page needs identical CTA modules with consistent UTM structures. Variation creeps in when teams copy-paste and modify. Lock templates at the CMS level where possible. Run monthly audits where it's not.
Profile Ownership
Each model center needs its own Google Business Profile. Conflating multiple communities into one profile destroys attribution and confuses the algorithm. Assign explicit ownership—one person responsible for each profile's accuracy and response time.
Operational Rhythm
Weekly: Review leading and mid-funnel indicators. Flag anomalies. Adjust if a community's visibility dropped or intent signals spiked without corresponding bookings.
Monthly: Report booked tours, show rates, and appointments by community. Compare against targets. Identify underperforming locations.
Quarterly: Audit UTM compliance, CRM status usage, and template consistency. Fix drift before it compounds. Check attribution coverage rate trends.
Risk Mitigation
Inconsistent UTMs corrupt attribution data. Mitigation: locked dropdown builders plus QA checklists before campaign launch.
CRM status drift makes reporting unreliable. Mitigation: required fields that block record progression plus monthly pipeline hygiene reviews.
Sales-marketing misalignment delays response to leads. Mitigation: documented tour booking SLA plus shared dashboard visibility.
Key Performance Indicators to Monitor
Weekly Review (Course Correction)
Focus on leading and mid-funnel indicators. Are impressions stable? Did direction requests spike or drop? Is tour CTA engagement tracking with historical patterns? Weekly review catches problems before they impact monthly numbers.
Monthly Review (Performance Assessment)
Report booked tours, show rate, and design-center appointments by community. This is the number leadership cares about. Present it in ladder format—leading indicators that drove mid-funnel engagement that converted to bookings—not as disconnected channel metrics.
Quarterly Review (Governance Audit)
Check attribution coverage rate: what percentage of booked tours have valid UTM data? Check template compliance: are all community pages using current CTA modules? Check for cannibalization: are communities competing against each other for the same terms?
Visibility is potential. Booked tours are the proof.
Frequently Asked Questions
Our Editorial Process: Our expert team uses AI tools to help organize and structure our initial drafts. Every piece is then extensively rewritten, fact-checked, and enriched with first-hand insights and experiences by expert humans on our Insights Team to ensure accuracy and clarity.
About the Brazos Valley Marketing Insights Team: The Brazos Valley Marketing Insights Team is our dedicated engine for synthesizing complex topics into clear, helpful guides. While our content is thoroughly reviewed for clarity and accuracy, it is for informational purposes and should not replace professional advice.
We help luxury homebuilders and community developers win affluent local intent and convert it into scheduled tours with schedule-aware, tour-first SEO programs.

About the Author
Dustin Ogle
Dustin Ogle is the Founder and Head of Strategy at Brazos Valley Marketing. With over 9 years of experience as an SEO agency founder, he specializes in developing the advanced AI-driven strategies required to succeed in the new era of search.